In today’s digital landscape, visual content is no longer optional—it is essential. Infographics, which combine data, visuals, and concise text, have become a powerful tool for bloggers in India and beyond. They simplify complex information, boost engagement, and improve readability, making content more shareable on social media. For bloggers targeting audiences in Tier 1 and Tier 2 cities, well-designed infographics can enhance credibility and drive traffic, turning casual readers into loyal followers.
Why Infographics Matter for Blogs
Infographics serve as a visual summary of information, helping readers grasp ideas quickly. In a world where attention spans are shrinking, this is particularly valuable. Blogs that include infographics tend to see higher engagement, longer time spent on pages, and increased sharing on platforms like Instagram, LinkedIn, and Twitter. For Indian bloggers, infographics also help convey regional trends, statistics, and localized insights in an appealing format.
Simple Tools for Creating Infographics
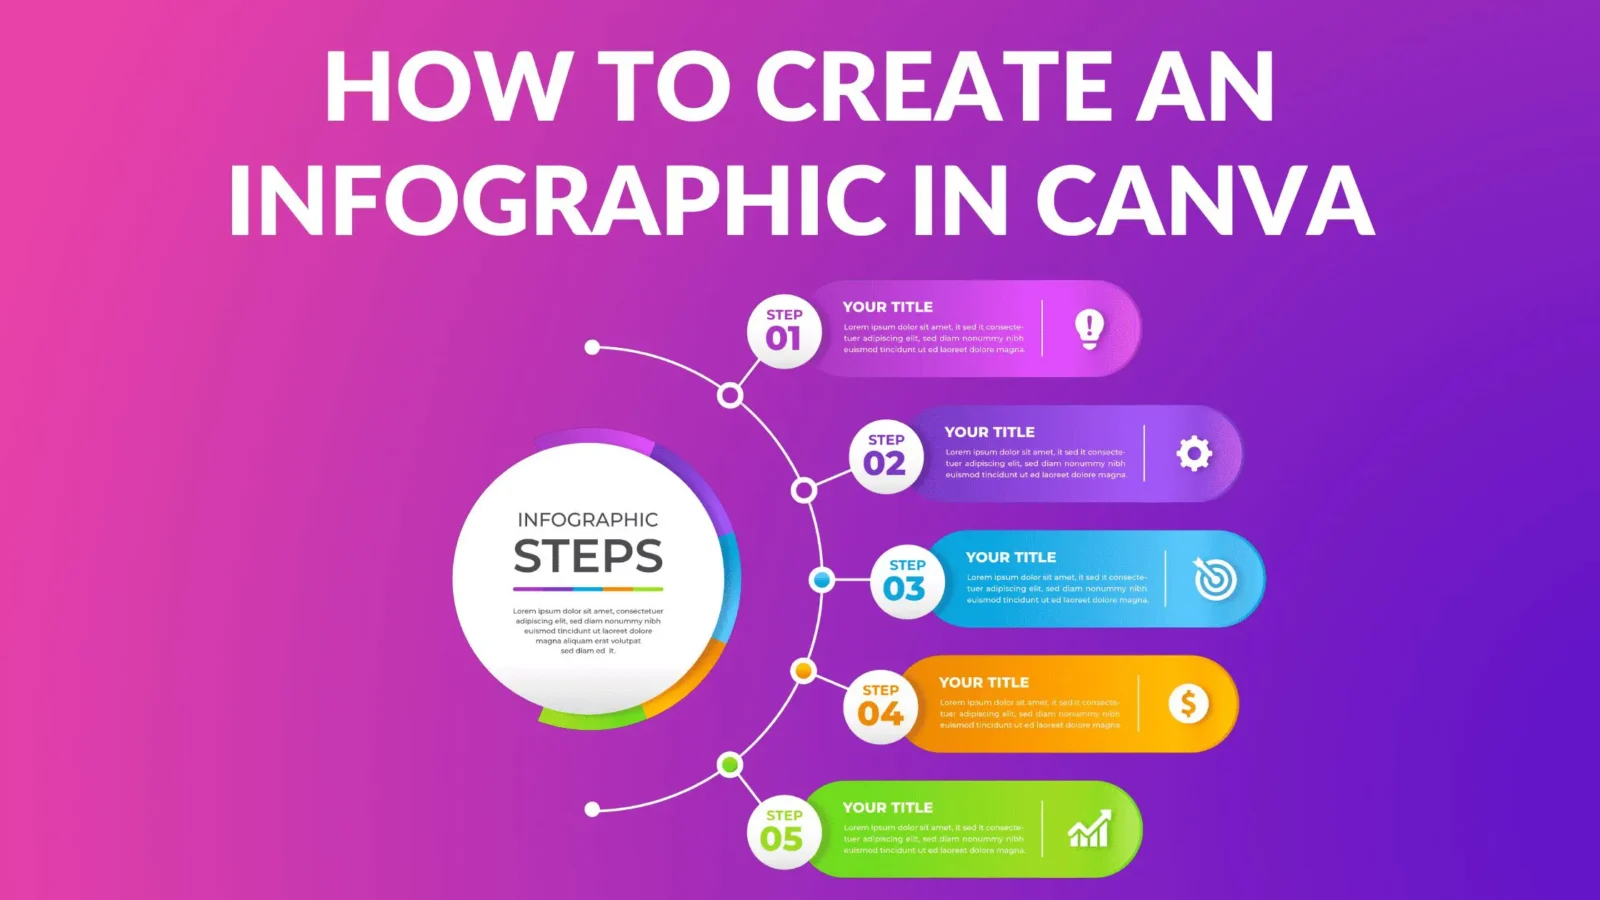
The easiest way to start is by using user-friendly design tools. Platforms like Canva, Visme, and Piktochart offer ready-made templates, drag-and-drop features, and customizable visuals that require no prior design experience. These tools allow bloggers to focus on content accuracy and creativity rather than complex graphic design techniques. Many of these tools also provide free options, making them accessible to new bloggers in Tier 2 cities who may have limited resources.
Step-by-Step Approach
Start by identifying the key message or data points you want to convey. Keep it concise and focused, as overcrowding an infographic with information can overwhelm readers. Next, choose a template that aligns with your blog’s aesthetic and customize it with colors, icons, and fonts that maintain readability. Add relevant charts, graphs, or illustrations to visually represent data, ensuring accuracy and clarity. Finally, optimize the file size for web use to maintain fast page loading speeds, which is important for SEO and user experience.
Tips for Maximum Impact
Consistency in design, color schemes, and font choices helps reinforce brand identity. Including clear headings and labeling graphics ensures information is easily understood. Sharing infographics on social media with engaging captions can amplify reach, while embedding them within blogs improves visual appeal and enhances SEO by increasing the likelihood of backlinks and shares.
Conclusion
Creating infographics doesn’t have to be a complicated process. With simple, accessible tools and a clear approach, Indian bloggers can transform data and ideas into visually compelling content that attracts readers and boosts engagement. By incorporating infographics, bloggers from Tier 1 and Tier 2 cities can make their blogs more informative, memorable, and shareable, enhancing their overall digital presence.


Leave a comment